Pseudotime
Pseudotime inference, or differentiation trajectory analysis in scRNA-seq, is a computational method used to model the continuous progression of cells as they differentiate from one state to another, such as from stem cells to specialized cell types. By analyzing transcriptomic similarities and differences among individual cells, this approach reconstructs trajectories that are typically visualized on dimensionality reduction spaces like PCA or UMAP, providing an abstract but informative representation of cellular transitions over inferred pseudotime. It uncovers the molecular steps and regulatory programs guiding cell fate decisions, helping identify key transition states, branching points (where trajectories separate), and the genes driving these processes.
slingshot
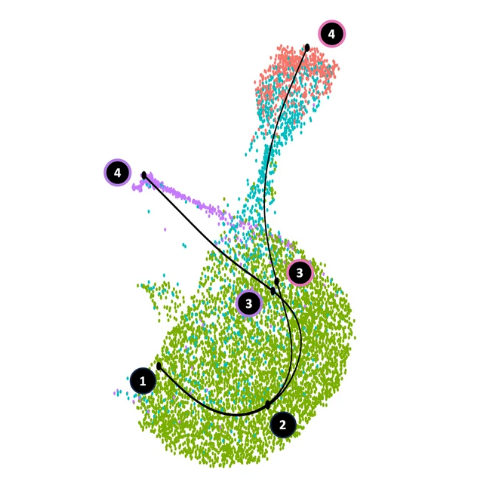
Among the many methods available to model differentiation trajectories on single-cell RNA-seq data, slingshot, and in particular its extension condiments, which can compute separate trajectories for different conditions in the same merged object, stand out. Unlike most other methods, they elegantly build smoothed curves on UMAP coordinates (figure 1A), which are visually more intuitive than tree-like structures (e.g., Minimum Spanning Tree (MST)-based approaches, like Lamian) (figure 1B), and avoids the overfitting tendencies observed in tools like Monocle3 (figure 1C).


tradeSeq
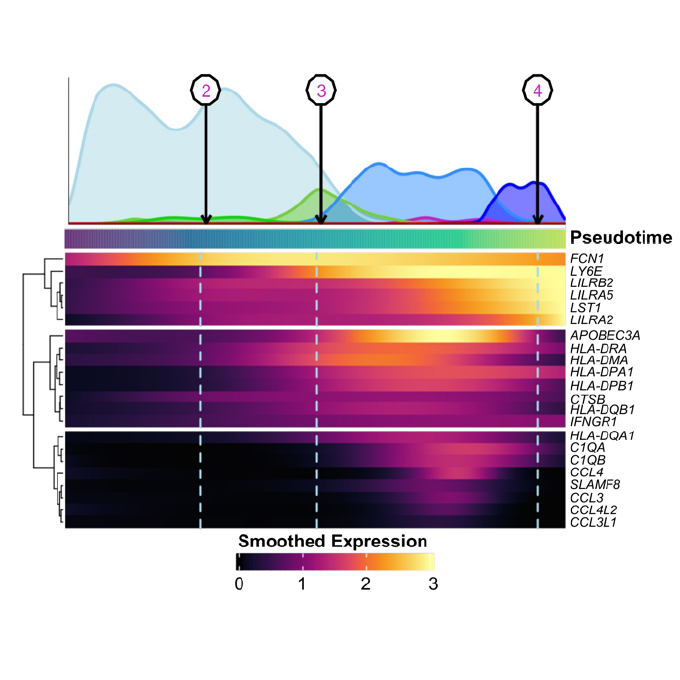
Determining which genes are differentially expressed between trajectories is key to understanding the biological switches responsible for cell fate decisions. For this purpose, the same team behind slingshot developed tradeSeq, a package built as a direct follow-up to slingshot. TradeSeq fits a negative binomial generalized additive model (NB-GAM) to smooth gene expression along trajectories and provides statistical tools to identify differentially expressed genes between lineages. While tradeSeq includes visualization functions, the package RightOmicsTools further extends these capabilities, offering additional features such as a heatmap with cell density along trajectories (Figure 2A) and an enhanced version of tradeSeq’s scatterplot and smoothed curves (Figure 2B).


Finally, you can find additional examples of slingshot and tradeSeq use in (Ramon et al., 2025).