This function generates a heatmap to visualize the expression of features in each cell of a Seurat object. Credits to Ming Tang for the initial idea to replicate DoHeatmap using ComplexHeatmap. Various new parameters were added to offer more flexibility and customization.
Usage
Cell_Heatmap(
  seurat_object,
  assay = "RNA",
  layer = "data",
  features,
  split.by = NULL,
  idents = NULL,
  split.idents = NULL,
  scale = TRUE,
  rescale = FALSE,
  rescale.range = c(0, 3),
  rotate.axis = FALSE,
  col.min = ifelse(isTRUE(scale), -2, "q0"),
  col.max = ifelse(isTRUE(scale), 2, "q100"),
  data.colors = if (isTRUE(scale)) c("#35A5FF", "white", "red") else "Viridis",
  palette.reverse = FALSE,
  na.color = "grey40",
  idents.colors = NULL,
  show.idents.names.colors = TRUE,
  show.idents.oppo.colors = FALSE,
  split.colors = NULL,
  show.split.names.colors = TRUE,
  show.split.oppo.colors = FALSE,
  order.idents = NULL,
  order.split = NULL,
  order.colors = TRUE,
  kmeans.repeats = 100,
  shuffle.cells = TRUE,
  cluster.cells = FALSE,
  cluster.features = TRUE,
  features.kmeans = 1,
  features.kmeans.numbers.size = 11,
  idents.gap = 1,
  features.gap = 1,
  idents.names.size = 9,
  features.names.size = 9,
  features.names.style = "italic",
  row.names.side = "left",
  row.names.width = 15,
  column.names.angle = 45,
  column.names.side = "top",
  column.names.height = 15,
  outer.border = TRUE,
  data.legend.name = ifelse(isTRUE(scale), "Z-Score", "Expression"),
  data.legend.side = "bottom",
  data.legend.direction = "horizontal",
  data.legend.position = "topcenter",
  data.legend.width = 5,
  idents.legend.name = "Clusters",
  show.idents.legend = TRUE,
  split.legend.name = split.by,
  show.split.legend = TRUE,
  legend.title.size = 10,
  legend.text.size = 10,
  legend.gap = 10,
  raster = ifelse(ncol(seurat_object) > 3000, TRUE, FALSE),
  raster.quality = 10,
  output.data = FALSE,
  ...
)
Arguments
- seurat_object
A Seurat object.
- assay
Character. The name of an assay containing the
layerwith the expression matrix. If theseurat_objectcontains multiple 'RNA' assays, you may specify which one to use (for example, 'RNA2' if you have created a second 'RNA' assay you named 'RNA2'. See Seurat v5 vignettes for more information). You may also use another assay, such as 'SCT', to pull feature expression from.- layer
Character. The name of a layer (formerly known as slot) which stores the expression matrix. It is recommended to use 'data'.
- features
Character. The names of one or several features to plot the cell expression from.
- split.by
Character. The name of a metadata (for example, 'orig.ident', 'seurat_clusters', etc) to split the identities of the active.ident metadata by.
- idents
Character. The names of one or several identities in the active.ident metadata to select. If
NULL, all identities are used.- split.idents
Character. The names of one or several
split.byidentities to select. IfNULL, all identities are used. Ignored ifsplit.by=NULL.- scale
Logical. If
TRUE, cell expression values will be scaled usingscaleand default parameters. The resulting values will be Z-scores (mean subtracted values divided by standard deviation) and not positive cell expression values anymore, which is why there will be positive and negative values displayed, depending on if the expression in a particular cell is below or above the mean expression from all cells (which is calculated independently for each feature).- rescale
Logical. If
TRUE, cell expression values will be adjusted usingrescalebetween the first numerical value ofrescale.range(lowest expression) and the second numerical value (highest expression). This is different thanscaleas this doesn't compare values to any mean and standard deviation and is therefore not a Z-score, it only refits each cell expression value (independently for each feature) in order to visualize allfeaturesin the same dimension regardless of their differences in levels of expression. Ignored ifscale=TRUE.- rescale.range
Numeric. The minimum and maximum values to resize the cell expression values and internally passed to
rescale. These values are arbitrary and will not change the visualization, only the values in the legend, you need to adjustcol.minandcol.maxto influence the color scale. Ignored ifrescale=FALSEorscale=TRUE.- rotate.axis
Logical. If
TRUE, flips the axis, so thatfeaturesare displayed as columns and identities as rows.- col.min
Character or Numeric. The minimum value for the
breaksinternally passed tocolorRamp2. If character, must be a quantile in the form 'qX' where X is a number between 0 and 100. A value of 'q5' or 'q10' is useful to reduce the effect of outlier values (i.e. a very low value that significantly alters the color scale range of all other values).- col.max
Character or Numeric. The maximum value for the
breaksinternally passed tocolorRamp2. If character, must be a quantile in the form 'qX' where X is a number between 0 and 100. A value of 'q95' or 'q90' is useful to reduce the effect of outlier values (i.e. a very high value that significantly alters the color scale range of all other values).- data.colors
Character or Function. Either three color names, corresponding to the lowest, zero (or middle if
scale=FALSE), and highest values in the expression matrix and internally passed tocolorRamp2, or two color names, corresponding to the lowest and highest values, or the name of a palette and internally passed tohcl_paletteincolorRamp2(such as 'Inferno', 'Berlin', 'Viridis' etc, checkhcl.palsfor all palettes available), or a customcolorRamp2function.- palette.reverse
Logical. If
TRUEand ifdata.colorsis a palette (such as 'Viridis'), the function will reverse its colors.- na.color
Character. The color name for missing values (
NA).- idents.colors
Character. The color names for each identity of the active.ident metadata or in
idents. IfNULL, uses Seurat's default colors.- show.idents.names.colors
Logical. If
TRUE, the function will display the colors specified inidents.colorsnext to identity names.- show.idents.oppo.colors
Logical. If
TRUE, the function will display the colors specified inidents.colorson the opposite side of identity names.- split.colors
Character. The color names for each
split.byidentity or insplit.idents. IfNULL, uses a custom set of colors fromcolors. Ignored ifsplit.by=NULL.- show.split.names.colors
Logical. If
TRUE, the function will display the colors specified insplit.colorsnext to identity names. Ignored ifsplit.by=NULL.- show.split.oppo.colors
Logical. If
TRUE, the function will display the colors specified insplit.colorson the opposite side of identity names. Ignored ifsplit.by=NULL.- order.idents
Character or Numeric. Either 'reverse', or the identities (as names or as numerical values corresponding to the indices) of the active.ident metadata or in
identsto order the cells.- order.split
Character or Numeric. Either 'reverse', or the
split.byidentities (as names or as numerical values corresponding to the indices) or insplit.identsto order the cells. Ignored ifsplit.by=NULL.- order.colors
Logical. If
TRUE, thedata.colorsandsplit.colorswill automatically be ordered according toorder.identsandorder.split. Ignored iforder.identsandorder.splitareNULL.- kmeans.repeats
Numeric. The number of runs to get a consensus K-means clustering. Ignored if
features.kmeans= 1.- shuffle.cells
Logical. If
TRUE, the function will randomize the distribution of cells in each identity. Useful to smooth expression, which limits visible batch effect (cells in a merged Seurat object are typically ordered based on the levels of the 'orig.ident' metadata, this might lead to unwanted patterns of expression in another metadata). Note that no values are modified, it only changes the order of cells in each identity. Ignored ifcluster.cells=TRUE.- cluster.cells
Logical. If
TRUE, the function will cluster the cells within each identity. Will have the opposite effect ofshuffle.cells, as it will order cells based on their expression similarity and will therefore increase batch effect. Useful to visualize if, within an identity, a subset of cells have high expression while the rest of the cells have low expression, or vice versa. Just likeshuffle.cells, no values are modified, it only changes the order of cells in each identity.- cluster.features
Logical or Function. If
TRUE, the function will cluster thefeatures. You may also pass anhclustordendrogramobject which contains clustering.- features.kmeans
Numeric. The number of slices to use for feature K-means clustering.
- features.kmeans.numbers.size
Numeric. The font size of the feature K-means slice numbers. Set to 0 to remove them.
- idents.gap
Numeric. The gap between the identity slices.
- features.gap
Numeric. The gap between the feature slices. Ignored if
features.kmeans= 1.- idents.names.size
Numeric. The font size of the identity names. Set to 0 to remove them.
- features.names.size
Numeric. The font size of the feature names. Set to 0 to remove them.
- features.names.style
Character. The font face of the feature names. The Gene nomenclature used by almost all scientific journals require that feature names are italicized, therefore the parameter is by default set to 'italic'. Use 'plain' to revert back to regular font face.
- row.names.side
Character. The side where the row names will be displayed, either 'left' or 'right'. The dendrogram will be displayed on the opposite side.
- row.names.width
Numeric. The width of the row names. Increase this parameter if your row names are truncated.
- column.names.angle
Numeric. The angle of rotation of the column names.
- column.names.side
Character. The side where the column names will be displayed, either 'top' or 'bottom'. The dendrogram will be displayed on the opposite side.
- column.names.height
Numeric. The height of the column names. Increase this parameter if your column names are truncated.
- outer.border
Logical. If
TRUE, the function will display an outer border around the heatmap or around each slice iffeatures.kmeans> 1.- data.legend.name
Character. The name of the data legend.
- data.legend.side
Character. The side where the data legend will be displayed, either 'left', 'right', 'top' or 'bottom'.
- data.legend.direction
Character. The direction of the data legend, either 'horizontal' or 'vertical'.
- data.legend.position
Character. The centering of the data legend name, there are many options, default option from
Heatmapis 'topleft'.- data.legend.width
Numeric. How long the data legend will be, only affects the data legend if
data.legend.direction= 'horizontal'.- idents.legend.name
Character. The name of the active.ident metadata legend. Ignored if
show.idents.names.colorsandshow.idents.oppo.colorsareFALSE.- show.idents.legend
Logical. If
TRUE, the function will display a legend for the active.ident metadata identities oridents. Ignored ifshow.idents.names.colorsandshow.idents.oppo.colorsareFALSE.- split.legend.name
Character. The name of the
split.bylegend. Ignored ifsplit.by=NULL. Ignored ifshow.split.names.colorsandshow.split.oppo.colorsareFALSE.- show.split.legend
Logical. If
TRUE, the function will display a legend for thesplit.byidentities orsplit.idents. Ignored ifshow.split.names.colorsandshow.split.oppo.colorsareFALSE.- legend.title.size
Numeric. The font size of all legend titles.
- legend.text.size
Numeric. The font size of all legend texts.
- legend.gap
Numeric. The gap between the legends and the heatmap. This parameter sets the value in the global options of
ht_opt, so it will affect allHeatmapobjects in the same R session. Use ComplexHeatmap::ht_opt(RESET =TRUE) to restore default parameters.- raster
Logical. (from
Heatmapdocumentation) IfTRUE, the function will render the heatmap body as a raster image. It helps to reduce file size when the matrix is huge.- raster.quality
Numeric. The quality of the raster image. A higher value will slow rendering but will lower expression smoothing. Ignored if
raster=FALSE.- output.data
Logical. If
TRUE, the function will return amatrixobject of the cell expression data, scaled or not, instead of displaying anything.- ...
Additional arguments to be passed to
Heatmap, such asshow_parent_dend_line,clustering_method_rows, etc, accepts any parameter that wasn't already internally passed toHeatmap(for example,outer.bordersets theborderparameter ofHeatmap, so you will get an error if you try to pass theborderparameter inCell_Heatmap).
Value
A Heatmap object, or a matrix object of the cell expression data, scaled or not.
Examples
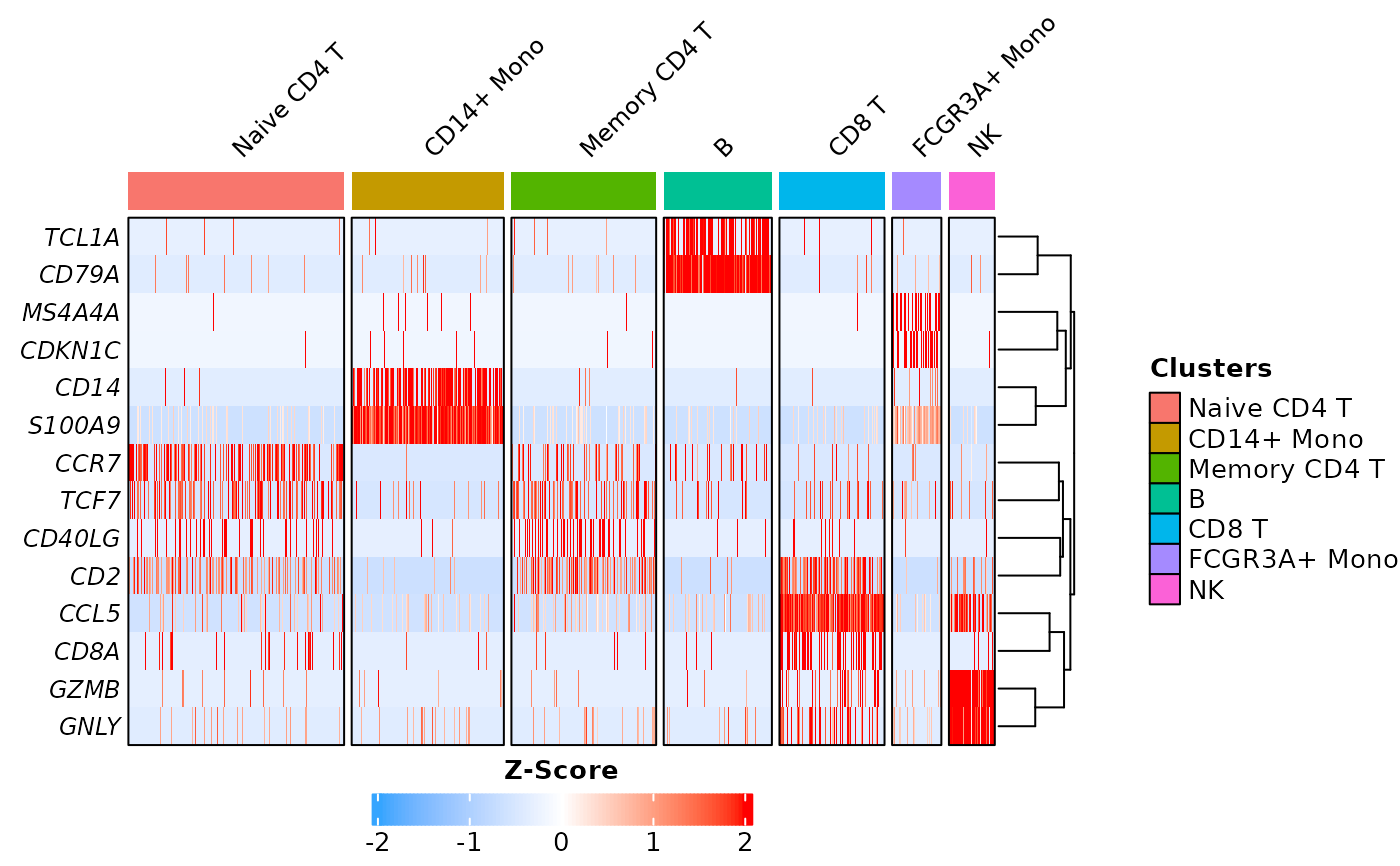
# Prepare data
pbmc3k <- Right_Data("pbmc3k")
pbmc3k.markers = c("CCR7", "TCF7", "S100A9", "CD14",
                 "CD40LG", "CD2", "CD79A", "TCL1A",
                 "CCL5", "CD8A", "CDKN1C", "MS4A4A",
                 "GNLY", "GZMB")

# Example 1: default parameters
Cell_Heatmap(pbmc3k,
             features = pbmc3k.markers)